$81,700 For Each Homeless in NYC
Segment #824
New York City’s disclosure of an $81,700 annual expenditure per homeless individual serves as a stark indictment of how public funds have been managed over the years. This figure should be a catalyst for public frustration regarding the systemic inefficiency of the current model.
The prevailing system creates a cycle of misaligned incentives:
For the Individual: The high volume of localized services can inadvertently create an incentive to remain within the system rather than transitioning out.
For the Institutions: Both NGOs and politicians are structurally incentivized to increase spending rather than solve the root problem, as their budgets and influence depend on the continued existence of the crisis.
New data shows that New York City spends nearly $81,000 per homeless person, but where is that money going? Despite more than tripling its efforts to tackle the crisis, the number of unsheltered individuals continues to rise. Taxpayers are left picking up the tab, and honestly, Kennedy’s over it.
Continuing to support the bureaucrats who oversee this framework essentially forfeits the right to complain about the results. Furthermore, the use of labels like "racist" or "elitist" to silence critics is a tactical distraction from the reality of the situation. It is a calculated financial cycle—a scam that requires taxpayers to finally wake up and demand accountability.
The Cycle of Misaligned Incentives
The "Triangle of Accountability" is particularly relevant here: when the entity providing the service (NGO), the entity funding the service (Government), and the entity assessing the value (Auditors) are too closely aligned, the taxpayer is the one who loses.
Would you like me to draft a version of this focused specifically on the "valuation" of these services compared to private-sector housing costs in Dallas or NYC?
A common theme across these studies is the "Housing First" comparison: the high cost of a person remaining on the street (ER visits, jail, police contact) versus the lower cost of providing supportive housing.
Comparative Annual Costs per Person
The following estimates are drawn from various municipal reports and economic studies:
New York City$81,700Shelter system, legal mandates, and emergency medical.
San Francisco$61,000 – $106,500High-cost "Safe Sleep" sites (tents) and specialized outreach
Los Angeles$35,000 – $100,000Health and medical services for "heavy service consumers."
Boston$18,700 – $45,000Primarily Medicaid/healthcare spending and specialized clinical care.
Chicago$20,000 – $35,000Supportive housing vs. shelter-based emergency interventions.
Minneapolis$12,800 – $83,000Varies by age; youth interventions are lower, chronic cases higher.
City-Specific Highlights
San Francisco: Recent 2021–2024 reports indicate that the Department of Homelessness and Supportive Housing budget averages over $100,000 per unhoused person. However, the city's "Safe Sleep" program (providing tents, food, and security) has specifically been cited as costing roughly $61,000 per person annually.
Los Angeles: An Economic Roundtable study found that a "chronically" homeless person with high needs can cost the public system over $100,000 annually in LA County, but that this cost drops by nearly 60% once the person is placed in permanent supportive housing.
Boston: Boston is often cited for its healthcare-first approach. Studies focused on the Boston Health Care for the Homeless Program show that unhoused individuals average $18,764 per year in Medicaid spending alone—roughly 2.5 times higher than housed residents.
Minneapolis: A 2024 landscape analysis by the City Auditor's office used Santa Clara County as a benchmark, citing public service costs of $83,000 per year per person, with 53% of that going to healthcare and 34% to criminal justice.
The "Triangle of Accountability"
As an appraiser, you might find the "triangle of accountability" reflected in these numbers:
Direct Spending: City budgets for shelters and sanitation.
Emergency/Public Services: Police, fire, and ER visits (often the largest "hidden" cost).
Long-term Savings: Studies consistently show that investing in Permanent Supportive Housing (PSH) reduces these annual figures by roughly $15,000 to $30,000 per person, as it stabilizes health and reduces interactions with the justice system.
Would you like me to find the most recent 2025/2026 budget reports specifically for the Dallas area to compare with these cities?
Median Household Income
The median household income represents the "middle" point of the economy in each city—half of the households earn more, and half earn less. Unlike the "mean" (average), the median is less affected by a small number of ultra-wealthy residents and provides a more realistic picture of what a typical household earns.
Based on 2024–2026 data from the U.S. Census Bureau and recent economic reports, here are the median household incomes for each city:
Median Household Income (2025/2026 Estimates)
CityMedian Household IncomeComparison to NYC Homeless Support Cost ($81,700)San Francisco$139,801~71% higher than support costBoston$127,954~57% higher than support costMinneapolis$109,129~34% higher than support costLos Angeles$98,148~20% higher than support costNew York City$81,228Roughly EqualChicago$77,902~5% lower than support cost
Key Takeaways from the Data
The NYC Parity: Notably, the median household in New York City earns almost exactly what it costs to support one homeless individual ($81,700 vs $81,228). This highlights why the figure is so frequently debated in policy circles; the public expenditure per unhoused person is effectively equivalent to the gross annual income of a typical middle-class NYC family.
Chicago's Gap: Chicago is the only city on this specific list where the median household income is actually lower than the reported NYC support cost.
Income Concentration: In San Francisco, while the median is high (~$140k), the mean income is often cited above $185,000. This $45,000 gap indicates that while the "typical" household is doing well, there is a massive concentration of wealth at the very top that pulls the average upward.
Housing Affordability: Even in Minneapolis, where the median income is a healthy $109,129, recent January 2026 data suggests that a household needs roughly $93,363 to afford a home. This leaves a very narrow "buffer" for the typical family compared to Los Angeles, where the income needed to buy a home (~$206k) is more than double the median income (~$98k).
Percentage of Households In Each City Living on Less Than Allocated to Each Homeless
This comparison highlights a striking economic reality: in several of these cities, the public cost to support one unhoused person is higher than what a significant portion of the city's own rent-paying, tax-paying households live on.
The table below calculates the percentage of households that earn less than the city-specific cost of homeless support.
Percentage of Households Earning Less Than the Homeless Support Cost
CityAnnual Cost per Homeless Person% of Households Living on LessNotesNew York City$81,700~50.2%Roughly half of NYC households earn less than the amount spent per unhoused person.San Francisco$106,500~38%Despite SF's high wealth, nearly 4 in 10 households survive on less than this support figure.Los Angeles$100,000~52%More than half of LA households earn less than the high-end cost of a chronically unhoused person.Boston$45,000~31%Boston has a lower support cost and a high median income, resulting in a smaller gap.Chicago$35,000~26%Roughly a quarter of Chicagoans earn less than the baseline $35k support cost.Minneapolis$83,000~44%Using the high-end $83k benchmark, nearly 45% of households fall below this line.
The "Cost vs. Income" Friction
These figures represent a significant point of tension in urban policy for three main reasons:
The Parity Point: In New York and Los Angeles, the cost to "maintain" an unhoused individual has reached a point of parity with the median household income. This means the city is effectively spending more on a single unhoused person than the typical family has to spend on its own housing, food, and taxes combined.
The "Housing First" Argument: Proponents of supportive housing often use these numbers to argue for a "mechanical" solution: if providing a permanent apartment costs $30,000/year but leaving a person on the street costs $80,000/year (in ER visits, police, and sanitation), housing them is a net gain for the taxpayer.
Local Perspective: To put this in a Texas context, the median household income in Dallas is approximately $63,900. If Dallas were to adopt the NYC spending model, the city would be spending 28% more per homeless person than its typical household earns in a year.
Would you like me to find the specific "Supportive Housing" vs. "Street" cost breakdown for the Dallas area to see how it compares to these other cities?
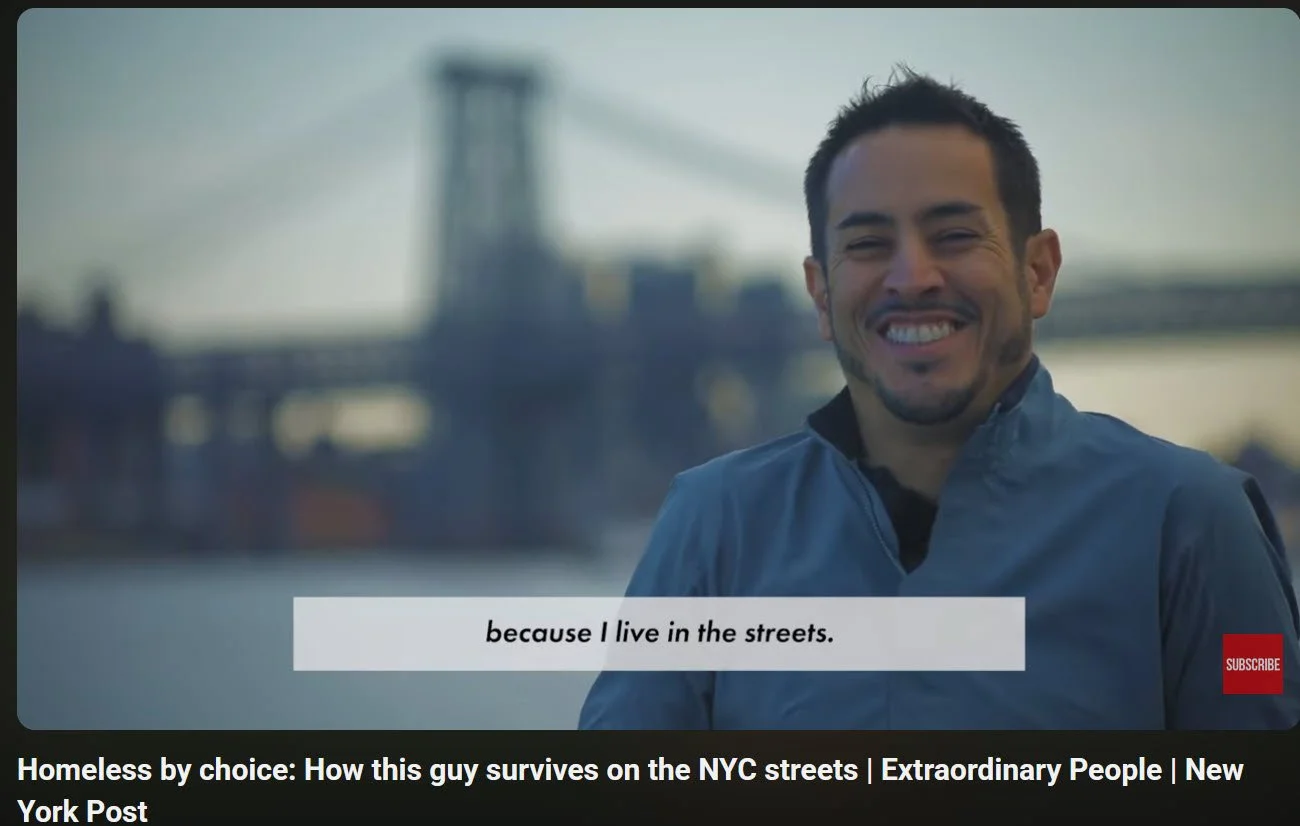
This happy camper saves $1,500 a month by sleeping on the streets. Meet Armando Esposito, a Mexican resident in New York City, who is homeless by choice. Surprisingly, he has a job, pays taxes and even finds time to watch Netflix. After four years of this unique lifestyle — hopping among rooftops, cemeteries and more — Esposito has been able to build two apartments and five lofts in Xalapa, Mexico. Watch his extraordinary story here.

Potential Fraud
Recent audits and federal investigations from 2024 through early 2026 suggest that significant fraud is not just a potential risk, but a documented reality in several major cities. The rapid influx of pandemic-era funding and a historic lack of oversight have created what federal prosecutors are now calling a "poster child of rampant fraud."
NewsNation's Lia Lando joins "NewsNation Prime" to discuss the latest developments after two people pleaded guilty in a $68 million fraud scheme tied to New York's Medicaid home care program.
Here are the most significant cases and systemic vulnerabilities identified in the cities you've been tracking:
Notable Fraud Cases (2025–2026)
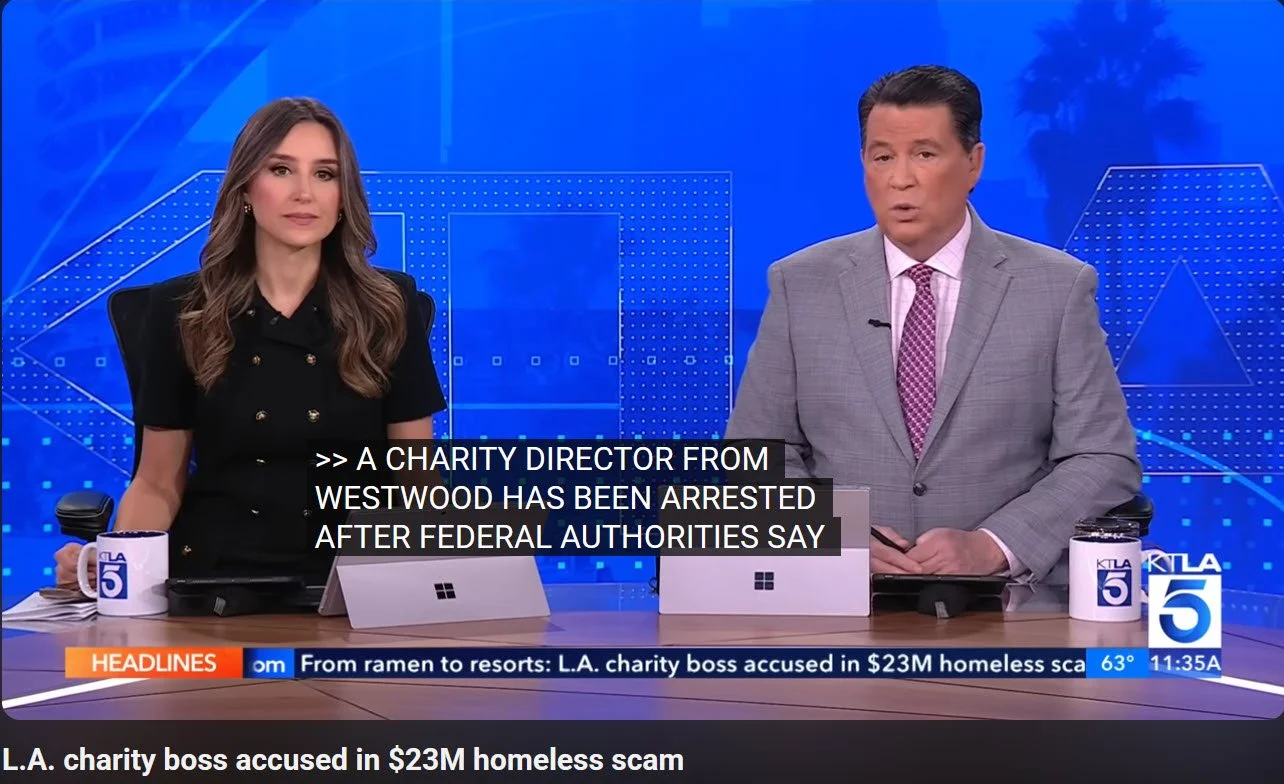
Federal prosecutors announced Friday that the head of a South Los Angeles charity was arrested on wire-fraud charges, accused of stealing more than $23 million meant to help people experiencing homelessness — and spending some of it on luxury travel, including stays at a Maui resort featured in HBO’s “The White Lotus.”
Authorities say Alexander Soofer, 42, ran Abundant Blessings, a Hyde Park-based nonprofit that received more than $23 million in homelessness funding between 2018 and 2025. Prosecutors allege he pocketed at least $10 million for a $7 million Westwood home, private jet trips, designer shopping and a vacation property in Greece.

Los Angeles ($23 Million Scheme): In January 2026, the CEO of the charity Abundant Blessings was arrested for allegedly swindling $23 million intended for homeless housing. Prosecutors allege he used at least $10 million of it to fund a luxury lifestyle, including a $7 million Westwood home, private jets, and stays at resorts featured in The White Lotus. While billing for full meals, investigators found he was actually serving only ramen noodles and breakfast bars.
San Francisco ($1.2 Million Misuse): In February 2026, the former CEO of the United Council for Human Services was charged with nine felonies for stealing over $1.2 million. The funds, meant for soup kitchens and shelters, were allegedly spent on luxury vehicles and high-end retailers like Louis Vuitton and Neiman Marcus.
Minneapolis ($104 Million Program Crisis): A massive "Housing Stabilization" fraud scheme was uncovered in 2025/2026. One provider, Brilliant Minds Services, allegedly submitted $2.3 million in fake bills. This follows the high-profile Feeding Our Future scandal, where $250 million in food aid—often linked to the same networks serving the unhoused—was embezzled.
Common Fraud "Playbooks"
Investigations have identified three recurring methods used to siphon funds:
"Ghost" Leasing: Providers create fake invoices for properties they claim to be renting for the homeless. In reality, they are often paying themselves "above-market rent" for properties they already own or that don't exist.
Kickback Enrollment: Agencies pay small cash kickbacks to unhoused individuals or families to sign up for services. The agency then bills the government for thousands in "consulting" or "support" fees that are never actually provided.
Credential Scams: Using high-school-aged relatives or unqualified staff and billing them out as "specialized behavioral technicians" or "case managers" at premium professional rates.
Systemic Oversight Failures
"Disorganized and Chaotic": A 2024 HUD audit gave California its lowest possible ranking for anti-fraud measures, noting that nearly $320 million was at high risk due to a complete lack of regular risk assessments.
Audit Defiance: In Los Angeles, major providers like the Weingart Center (which received over $100M) were recently flagged for failing to comply with mandatory federal audit requirements while still continuing to receive public funds.
NYC Data Gaps: A July 2025 audit of NYC's Department of Homeless Services found that 16% of costs at one major non-profit ($4.5 million) were non-compliant, unsupported, or "over-allocated," suggesting that city monitoring is failing to catch basic billing errors.
The "Homelessness Fraud and Corruption Task Force": Launched in 2025 by the U.S. Attorney’s Office, this multi-agency group (including the FBI, IRS, and HUD) is currently specifically targeting seven California counties to recover billions in unaccounted-for spending.
Given your professional background in appraisal and "triangles of accountability," would you like to see a breakdown of the specific valuation red flags these task forces are looking for in NGO property leases and service contracts?